WebGIS Projects | Institute of Hydrology and Water Management
A portal for our ongoing research and development initiatives.
A portal for our ongoing research and development initiatives.
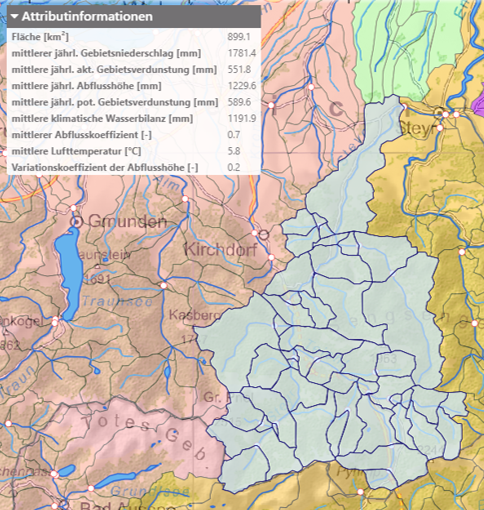
The official webGIS prototype of the Hydrological Atlas of Austria, offering interactive maps and data tools to explore the nation's water resources.
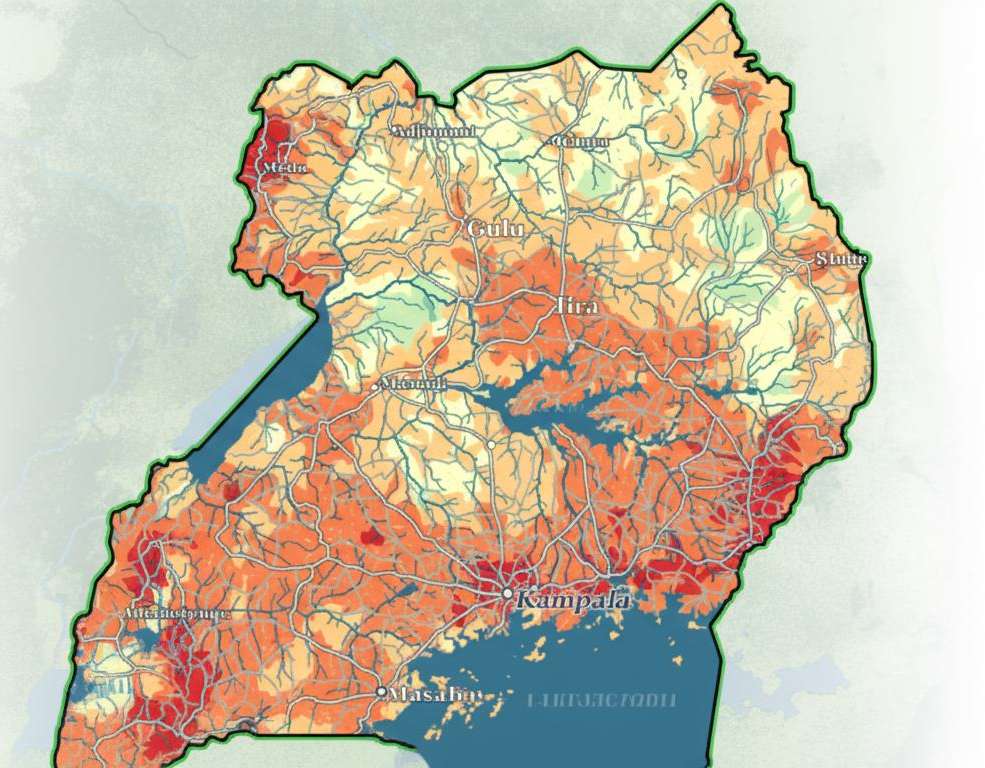
A national mapping initiative to understand and manage water quality in Uganda by identifying key drivers and pressures, supported by a comprehensive geodatabase and WebGIS. More info
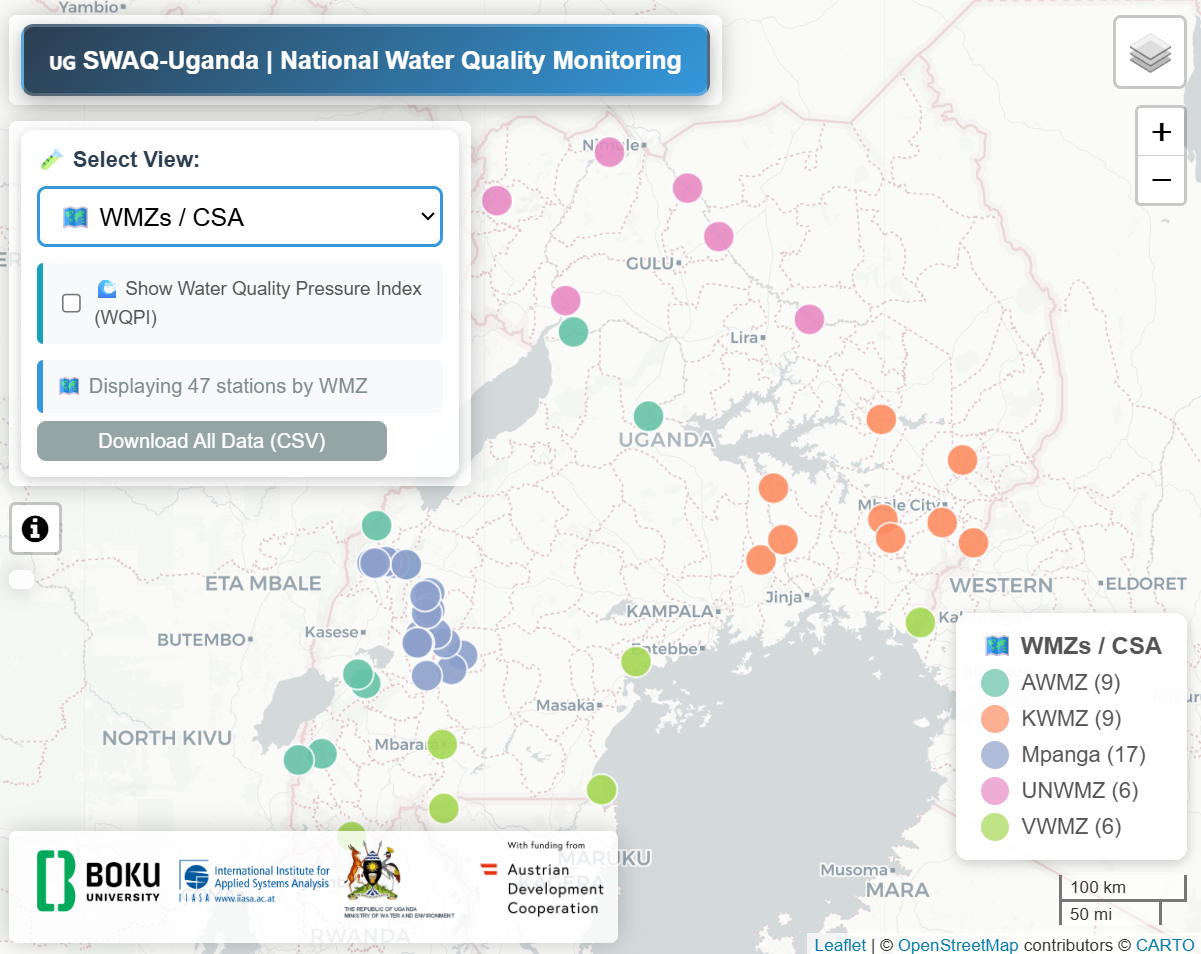
An interactive platform visualizing surface water quality data from monitoring stations across Uganda's Water Management Zones, featuring water quality parameters, indices (GWQI, CPI), pressure assessments, and risk analysis. More info
A WebGIS for the LamaH-CE dataset, providing interactive visualisatio of discharge stations and catchment attributes for 859 gauged basins across Central Europe. Data | Paper (ESSD) | Paper (ÖWAW)
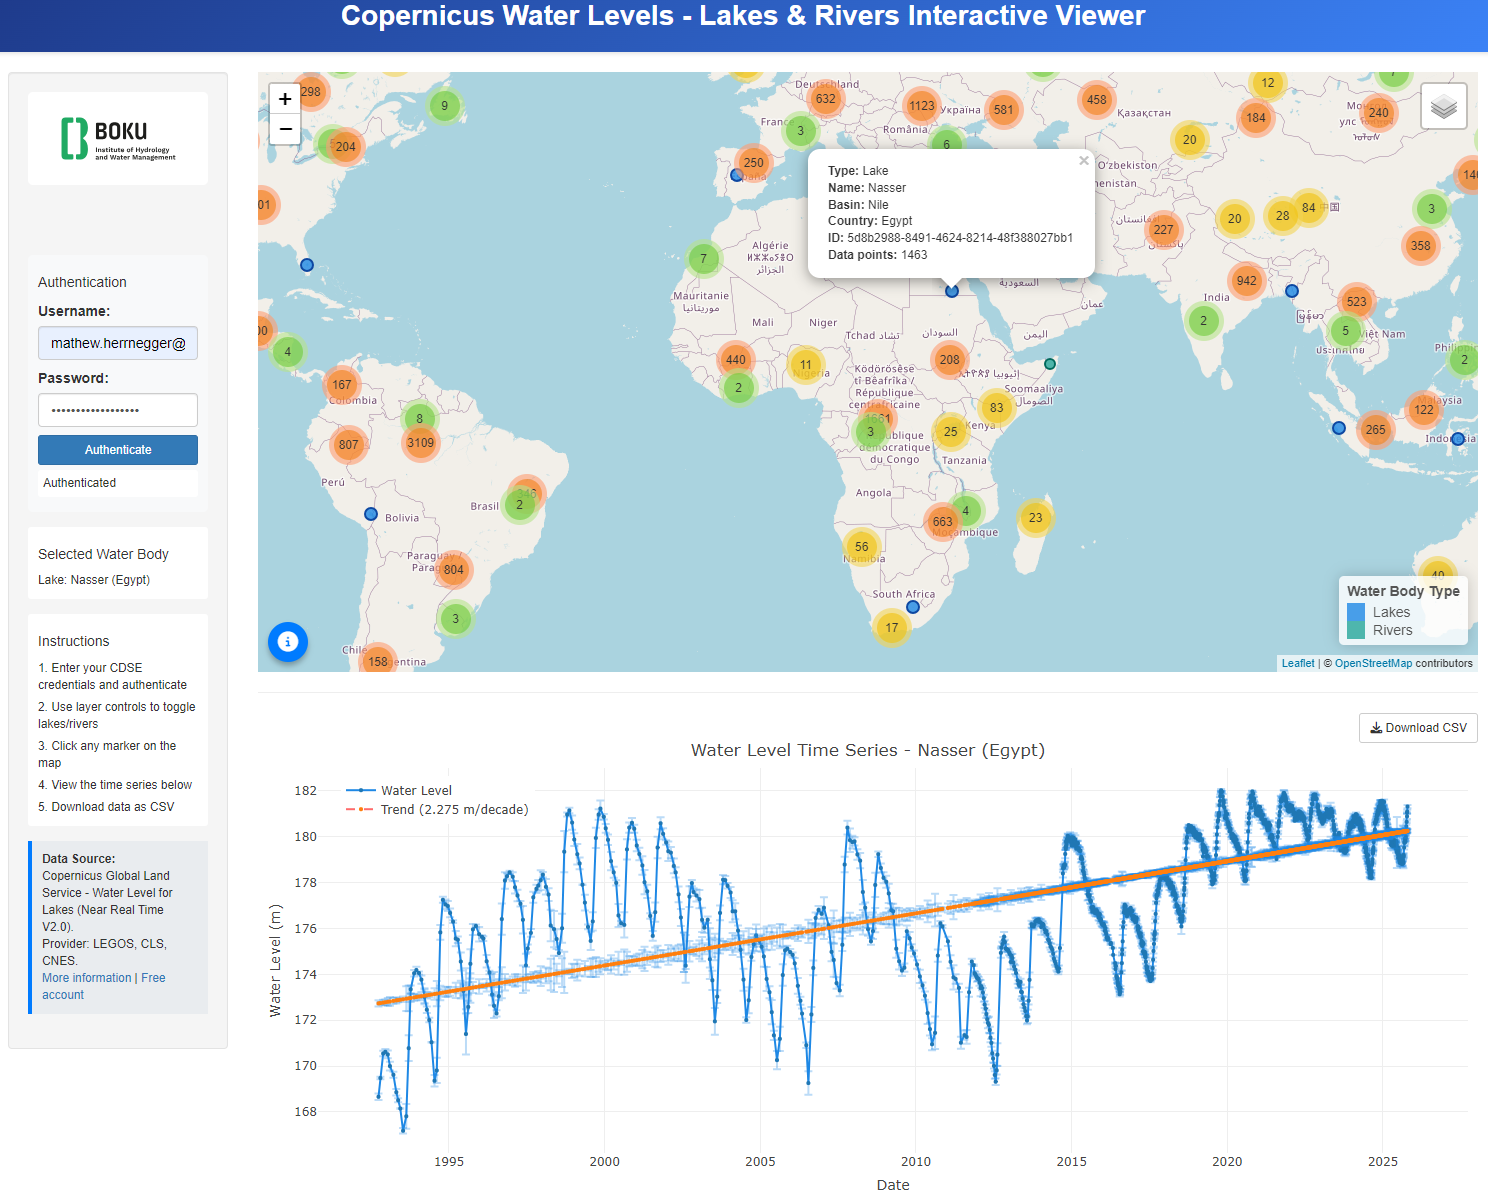
Interactive Shiny web application for visualizing water level time series data from the Copernicus Global Land Service. Displays 2000+ lakes and rivers worldwide with satellite altimetry measurements, featuring real-time data download, trend analysis, and data export functionality. Data Source
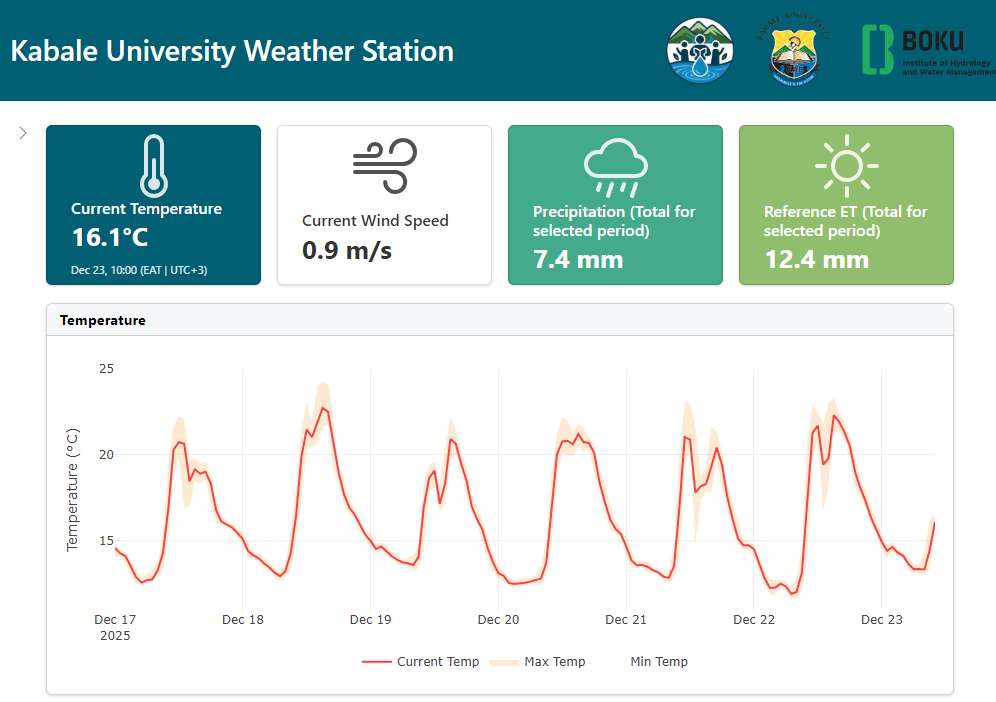
Real-time meteorological data from Kabale University, Uganda. Part of the KI-WATER project, this Dashbord provides 5-minute interval measurements of temperature, precipitation, wind, solar radiation, and reference evapotranspiration to support Integrated Water Resources Management in the Kigezi Highlands.